
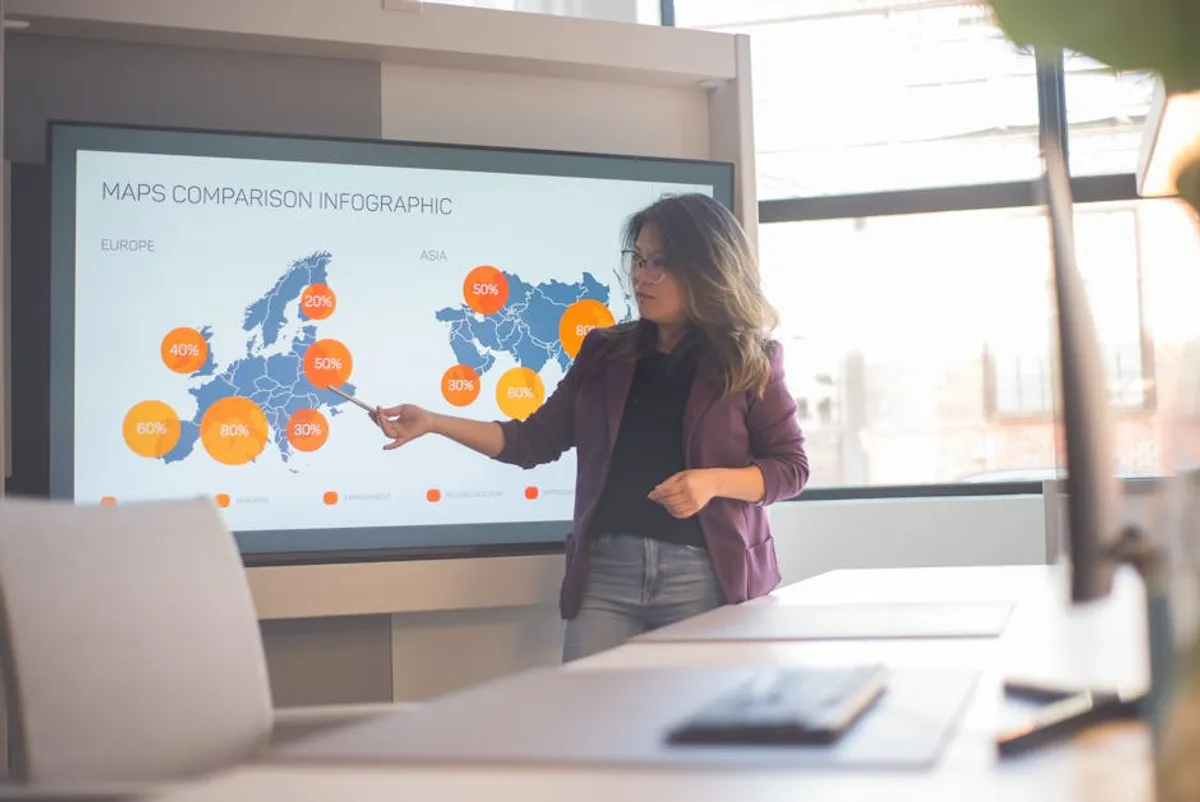
Infographics serve as a potent visual communication tool, condensing complex data or concepts into easily digestible, shareable formats. For marketers, content creators, and businesses, an effective infographic can cut through information overload, capturing audience attention and conveying key messages faster than text-heavy alternatives. The decision to create an infographic is a strategic one, aimed at improving engagement, enhancing brand authority, and driving traffic through visual storytelling. This guide outlines the systematic process for developing infographics that resonate with target audiences and achieve specific commercial objectives. By creating visual content that supports seo, you can further enhance your infographic's reach.
Understanding Infographic Purpose and Audience
Before any design work begins, define the core objective of your infographic. Is it to educate, persuade, compare, or illustrate a process? A clear purpose dictates the content, structure, and visual style. Without a defined goal, the infographic risks becoming a collection of data points without a cohesive narrative.
Defining Your Core Message
Identify the single most important takeaway you want your audience to grasp. This "north star" message should be concise and serve as the central theme for all visual and textual elements. For instance, if the goal is to demonstrate market growth, the core message might be "Industry X grew by 25% in Q3 due to Y factors." Every piece of data, every icon, and every color choice should reinforce this central idea. Overloading an infographic with too many disparate messages dilutes its impact.
Identifying Your Target Audience
Who is this infographic for? Understanding your audience's demographics, existing knowledge, and pain points is critical. An infographic for industry experts will differ significantly in terminology, data depth, and visual complexity from one aimed at general consumers. Tailoring the content and design to their specific needs ensures relevance and maximizes engagement. Consider what questions they have, what problems they face, and how your infographic can provide valuable insights or solutions.
Data Collection and Curation
The credibility of an infographic hinges on the quality and accuracy of its underlying data. This phase involves meticulous research and careful selection of information.
Sourcing Reliable Data
Utilize reputable sources such as academic studies, government reports, industry analyses, and primary research. Cite all sources clearly within the infographic, typically in a small font at the bottom. This transparency builds trust and allows interested readers to verify information. Avoid anecdotal evidence or unverified statistics, as these can undermine the infographic's authority and lead to misinformation.
Structuring Your Information Logically
Once data is collected, organize it into a coherent narrative. Create an outline that flows logically, guiding the viewer through the information. A common structure includes an introduction, key data points, supporting details, and a conclusion or call to action. Group related data, identify trends, and highlight compelling statistics. This pre-design structuring prevents a jumbled appearance and ensures a clear progression of ideas.
Choosing the Right Infographic Type
The type of infographic you choose should align directly with your data and narrative. Selecting an appropriate format enhances clarity and visual appeal.
- Statistical Infographic: Best for presenting numerical data, percentages, and survey results. Uses charts, graphs, and large numbers to emphasize quantitative information.
- Timeline Infographic: Ideal for illustrating chronological events, historical developments, or project phases. Employs a linear layout to show progression over time.
- Process Infographic: Effective for explaining step-by-step procedures, workflows, or how something works. Uses arrows, numbered steps, and sequential layouts.
- Geographical Infographic: Suitable for displaying location-based data, regional comparisons, or demographic distribution. Incorporates maps and region-specific visuals.
- Comparison Infographic: Useful for highlighting similarities and differences between two or more items, concepts, or products. Often uses a split layout or side-by-side columns.
- Hierarchical Infographic: Good for illustrating organizational structures, ranking systems, or decision trees. Uses pyramid, tree, or flow-chart structures.
Design Principles for Impact
Effective design transforms raw data into an engaging visual story. Adhering to fundamental design principles ensures readability and aesthetic appeal.
Visual Hierarchy and Flow
Guide the viewer's eye through the infographic using a clear visual hierarchy. Larger fonts, bolder colors, and prominent placement draw attention to the most critical information first. Use white space strategically to prevent clutter and improve readability. A natural flow, often from top to bottom or left to right, ensures the audience can easily follow the narrative without confusion.
Color Palette and Typography
Select a color palette that aligns with your brand identity and enhances readability. Limit the number of colors to avoid visual chaos, typically using one or two primary colors with complementary accents. Typography should be legible and consistent. Choose fonts that are easy to read at various sizes and use a maximum of two to three font families to maintain a professional appearance. For instance, a sans-serif font for body text and a serif font for headings can create contrast and visual interest.
Iconography and Visual Assets
Icons, illustrations, and simple graphics can replace lengthy text, conveying concepts quickly and effectively. Ensure all visual assets are consistent in style and quality. Use icons to represent data points, processes, or categories. High-quality imagery and graphics elevate the infographic's professionalism and make it more engaging than plain text alone.
Pro Tip: Always design with mobile responsiveness in mind. A significant portion of your audience will view infographics on smartphones. Ensure text is legible, images scale correctly, and the overall layout remains clear on smaller screens. Test your infographic across various devices before final distribution to prevent a degraded user experience.
Infographic Creation Tools
Various platforms facilitate infographic creation, ranging from professional design software to user-friendly online builders. When selecting a tool, consider its library of templates, icon sets, data visualization options (charts, graphs), and export capabilities (e.g., PNG, JPG, PDF). Look for features that allow for brand customization, such as uploading custom fonts and brand colors. The ideal tool balances ease of use with sufficient design flexibility to execute your vision effectively.
Distribution and Promotion Strategies
Creating an infographic is only half the battle; effective distribution ensures it reaches its intended audience and maximizes its commercial value.
Embedding and Sharing
Host the infographic on your website or blog, providing an embed code for easy sharing by others. This allows other sites to display your infographic while linking back to your original content, generating valuable backlinks and referral traffic. Share the infographic across all relevant social media platforms, tailoring the accompanying text and hashtags to each platform's audience. Consider creating smaller, bite-sized snippets of the infographic for social media to pique interest and drive clicks to the full version.
Outreach and Syndication
Identify industry blogs, news outlets, and influencers who might find your infographic valuable to their audience. Reach out with a personalized email, explaining the infographic's relevance and offering it for publication or mention. Submitting your infographic to relevant directories or visual content platforms can also increase its visibility. This proactive outreach expands your content's reach beyond your immediate network.
Practical Considerations for Infographic Success
To maximize the return on your infographic investment, focus on measurable outcomes and continuous improvement. Track metrics such as page views, social shares, backlinks generated, and any associated lead conversions. This data provides insights into what resonates with your audience and informs future content strategy. Ensure accessibility by providing alternative text for images and considering color contrast for users with visual impairments. An infographic is a dynamic asset; be prepared to update data or refine visuals as new information becomes available or as audience preferences evolve. The goal is not just to create an image, but to produce a valuable, shareable asset that consistently delivers on its commercial objectives.
Frequently Asked Questions
What is the optimal length for an infographic?
There's no strict rule, but most effective infographics are long enough to convey the message without being overwhelming. Aim for a length that allows for clear visual separation of data points and maintains a logical flow, typically between 800 to 2000 pixels in height for web display.
How can infographics benefit SEO?
Infographics can improve SEO by attracting backlinks when other sites embed or reference them, increasing organic traffic, and boosting social shares. They also contribute to a richer user experience, potentially reducing bounce rates and increasing time on page, which are positive signals for search engines.
Should I include a call to action in my infographic?
Yes, including a clear call to action (CTA) is highly recommended, especially for commercially-oriented infographics. This could be a website visit, a download, a subscription, or contact information. Place the CTA strategically at the end, ensuring it's concise and visually distinct.
What file format is best for infographics?
For web use, PNG is generally preferred for its ability to handle sharp lines and text, and its lossless compression. JPEG can be used for infographics with many photographic elements, but may introduce artifacts. For print, PDF is the standard due to its vector capabilities and high resolution.